Laptrail Unofficial fan app Open the app

Unofficial Formula 1 fan app · 2026 season

Laptrail Every lap, traced.

Every session of a Formula 1 weekend – practice, qualifying, sprint and race – rebuilt from the official live-timing archive as a 3D replay, a 2D map and in-depth analysis, right in your browser.

Latest race in the app: Bahrain Grand Prix in Malaysia, Sepang

  • 22 cars on the session clock
  • 5 session types from FP1 to the race
  • Automatic builds after every session
  • No account and nothing to install
Scroll to explore

This weekend and the latest results

The season

The season calendar, every session’s status and the latest results are in the app.

Open the season

Inside the app

One weekend, every angle

Season, event, session: pick a weekend and every session opens on its overview – results, weather, flags and the Safety Car – with the replay, the 2D map and the analysis one tap away.

Malaysia 2026, Q3 – VER’s pole lap against HAM from the helmet camera, into turns 1 and 2.

01 · Lap comparison

Any lap against any lap, in 3D

Pick a lap of any driver and race it against up to four others: pole against pole, first run against second, teammate against teammate. Every car is placed on the track from the timing data and drives it lap for lap.

  • TV, chase, onboard, helmet, rear and helicopter cameras – or a free one
  • The live steering-wheel display in the helmet camera
  • Gaps in time and metres, head-to-head telemetry, corner by corner
  • Straight Mode zones and the engine note of each power unit
Try it: VER v HAM, Malaysia Q3
Malaysia 2026, race – the first corners after the standing start, with the auto director.

02 · Full race

The whole race, every car

All 22 cars and the Safety Car on the session clock, from the formation lap to the chequered flag. The start lights go out when the telemetry says they did; flags follow the marshal sectors; pit stops, red flags and retirements happen where they happened.

  • A timing tower with intervals or gaps to the leader
  • An auto director that cuts to the battles – or your own camera on any car
  • Race control messages and key moments on the timeline
  • The same view for practice and qualifying: Q1–Q3, the drop zone and deleted laps
Watch the latest race
The 2D map of Sepang on lap 4 of the race: every car as a numbered dot on the circuit, the timing tower on the left and the race timeline below
The 2D map: the whole field on lap 4, the order and intervals beside it.

03 · 2D map

The field from above

One key switches the replay to a map of the whole circuit: who is closing in, who is in the pits, how the field bunches up behind the Safety Car. Zoom in on a battle or follow one car around the lap.

On phones the full race opens here – light on the battery, clear on a small screen – with 3D one tap away.

04 · Session analysis

Analysis written for each session

Practice gets long runs, tyres and top speeds; qualifying gets mini-sectors, every corner, G-forces and straight-line energy; the race gets the lap chart, gaps, strategy, pit stops, overtakes and race pace. Each chart opens the replay at the moment it shows.

Race analysis, lap chart: the official order after every lap of the Malaysia race, with pit stops and the Safety Car periods, VER, ANT and HAM highlighted
Race · Lap chart – the official order after every lap, pit stops, retirements and the Safety Car.
Weekend analysis, progress: every driver’s gap to the fastest from FP1 to the race, VER, ANT and HAM highlighted
Progress – the gap to the fastest, session by session.

05 · Weekend analysis New

FP1 to the flag in one view

The weekend analysis puts every session side by side and follows each driver from first practice to the race.

  • Progress, track evolution and long runs against race pace
  • Qualifying against the result, teammate against teammate
  • Sectors, top speeds, mileage, tyres, consistency and weather
Open the Malaysia weekend analysis

06 · On your phone

Built for the small screen too

The same app on a phone, laid out for it: the way back always at hand, the full race in the 2D map, the lap comparison in 3D, every chart reflowed for a narrow screen. Nothing to install.

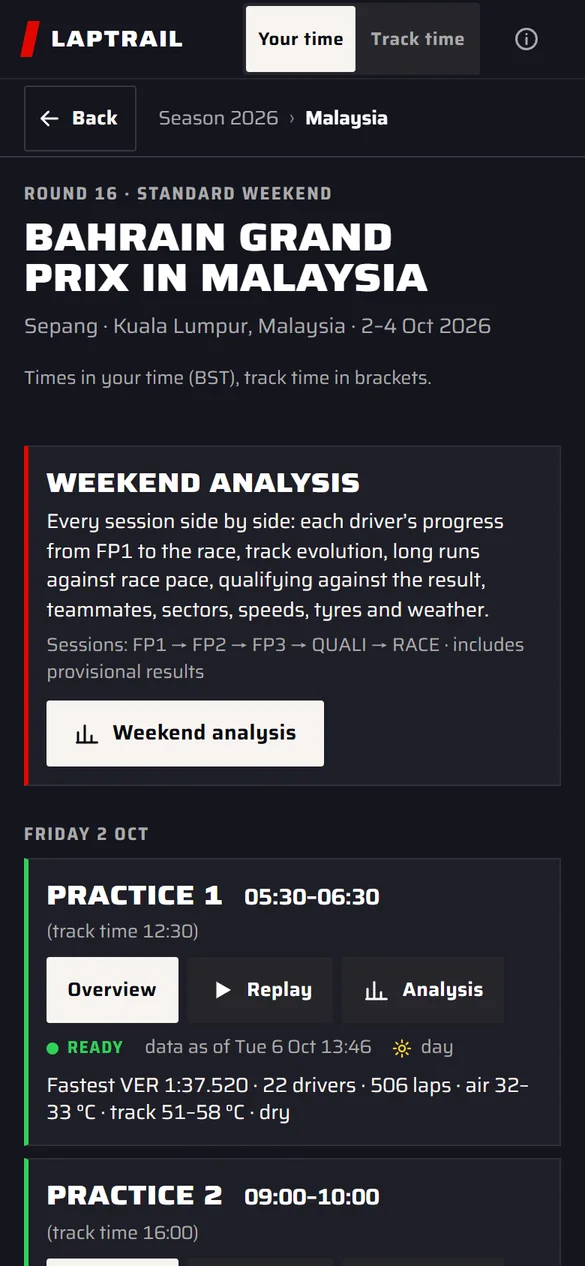
  • Phone: the Malaysia weekend page with the weekend analysis and the sessions of FridayWeekend
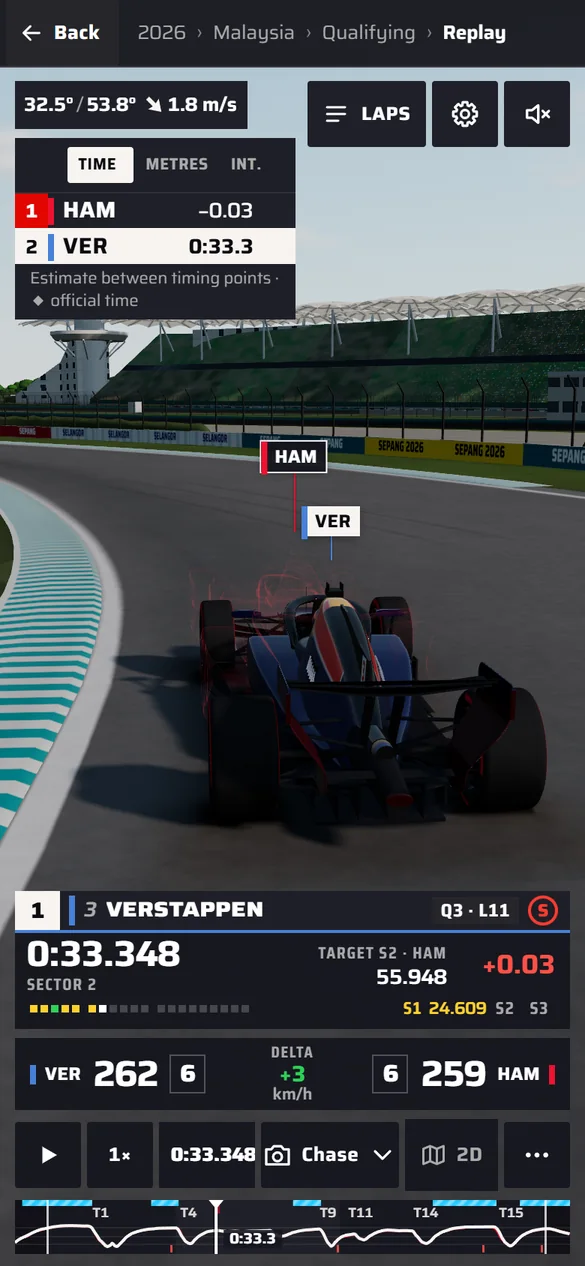
  • Phone: the lap comparison in 3D, VER against HAM through turn 5, with the gap and both speedsLap comparison
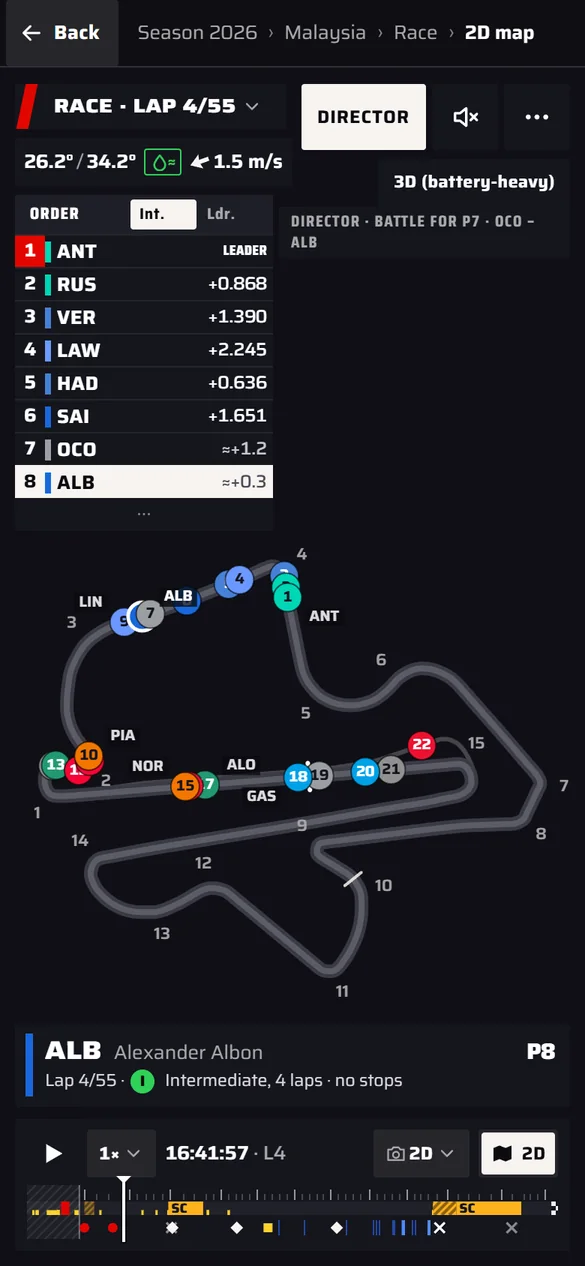
  • Phone: the full race in the 2D map with the top eight of the order above the circuitFull race
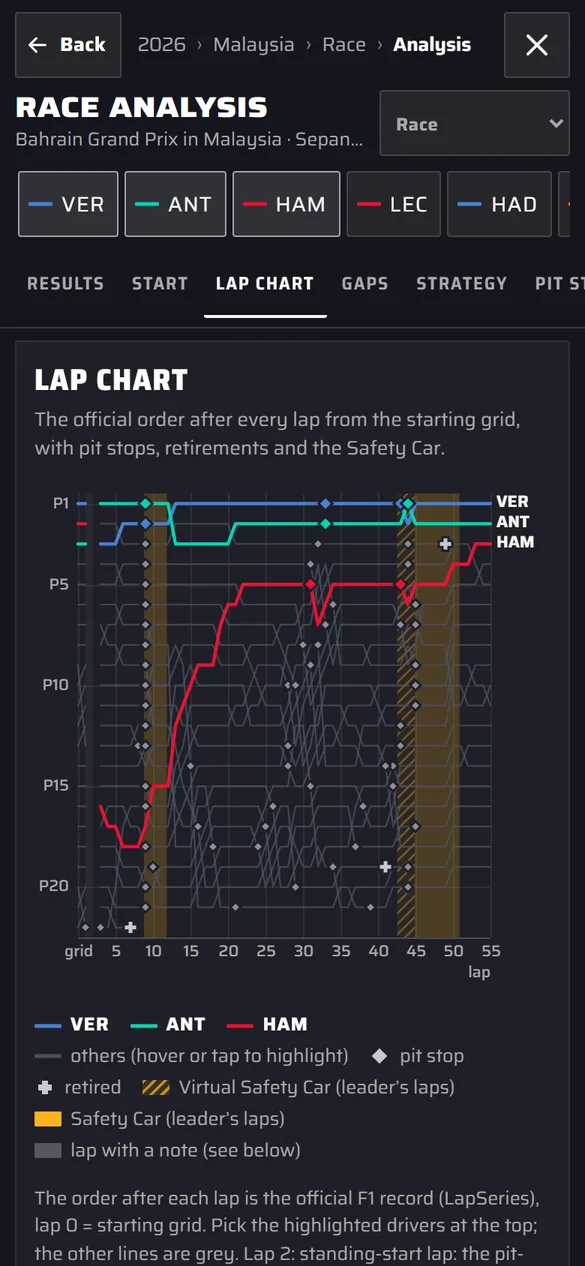
  • Phone: the race lap chart reflowed for a narrow screenAnalysis

How it works

From the timing archive to your screen

No broadcast footage and no guesswork dressed up as data: everything starts from the timing data F1 publishes after each session.

  1. The F1 live-timing archive

    After every session F1 publishes its timing archive: lap and sector times, car telemetry and positions about four times a second, race control, tyres, pit stops and the weather station.

  2. FastF1 and the raw feeds

    The pipeline reads it with the open-source FastF1 library and the archive’s own feeds, puts every lap on the session clock and checks the result before it is published.

  3. Circuit packs

    Each circuit is built once: track and kerbs, pit lane, marshal sectors and surroundings from OpenStreetMap, SRTM elevation, the TUMFTM racetrack database and FIA documents, fitted to the timing data.

  4. Built automatically

    An updater follows the calendar. The archive appears about 20–30 minutes after the chequered flag; the session is built and in the app shortly after, and rebuilt when results are final.

  5. Your browser

    Static files and WebGL 2: the replay runs on your own device, in Chrome, Edge, Firefox or Safari – no plug-in, no account.

What’s in the data

Measured, or labelled as an estimate

The timing data are rich but not complete – positions arrive a few times a second, and some things are not measured at all. Wherever the app shows something it worked out rather than read, it says so.

Measured From the timing archive

  • Lap, sector and mini-sector times, speed traps, deleted laps
  • Car telemetry: speed, RPM, gear, throttle and brake (about 4 Hz)
  • Car and Safety Car positions on track
  • Race control messages, flags, Safety Car and red-flag periods
  • Tyre compounds and stints, pit stops, penalties, results
  • Air and track temperature, wind, humidity and rain – once a minute

Estimate Worked out, and marked

  • A car’s position between two timing points
  • Power, G-forces, braking points and the Straight Mode state
  • Kerb contact and the illustrative “use kerbs” line
  • Engine sound, spray, sparks and car looks – illustrative
  • Racing lines: every lap follows one reference line, so individual lines are not shown as data

Results stay marked provisional until the stewards are done; the updater rebuilds the session when they change. Every page says when its data were built.

Circuits

Circuits in 3D

A circuit needs a pack before its sessions can be replayed. Every other round of the season still gets the session overviews – results, weather, flags – as soon as the archive is out.

  • Sepang International Circuit

    Malaysia · permanent circuit · 5.54 km

    Hand-tuned pack · 2026 Malaysia

  • Marina Bay Street Circuit

    Singapore · street circuit · night · 4.91 km

    Generic pipeline · 2026 Singapore · 2025 test data

FAQ

Questions

Short answers about the data, the circuits and what the app is – and is not.

Is it live?

No. Laptrail works from the official timing archive, which F1 publishes about 20–30 minutes after each session. An updater then builds the session automatically, so it is usually in the app within the hour. While a session runs, the app shows the schedule and, once it has ended, what the updater is waiting for.

Where does the data come from?

From the F1 live-timing archive, read with the open-source FastF1 library and the archive’s raw feeds. The circuits come from OpenStreetMap, SRTM elevation data, the TUMFTM racetrack database and FIA documents. Nothing is taken from TV pictures.

Which circuits can I watch in 3D?

The ones listed under Circuits – the list comes straight from the app. Every other round of the season still gets its session overviews with results, weather and flags; the replay follows when the circuit gets its pack.

Does it work on a phone?

Yes. Phones get a layout of their own: the full race opens in the 2D map, which is light on the battery, and the 3D view is one tap away. A recent browser with WebGL 2 is all it needs – Chrome, Edge, Firefox or Safari 17 and newer.

Do I need an account?

No. There is nothing to sign up for and nothing to install: open the app in your browser. Your settings – camera, graphics quality, time zone – stay on your device.

Do you track me?

No. There are no cookies, no analytics scripts and no ad or tracking services. To know how many people visit, the web server counts page loads: its log keeps the time, the page and what your browser sends with the request (such as its name and language), with your IP address shortened to its network – never the full address – and is deleted after a year.

Who makes Laptrail?

Laptrail is a personal project by Miloslav Szczypka, built out of curiosity about what the public timing data can show. Feedback, ideas and bug reports are welcome on LinkedIn.

Is this official?

No. Laptrail is an unofficial fan project with no connection to Formula 1, the FIA or the teams. The cars are generic models in team colours, without logos, and anything estimated is labelled as such.

Pick a session. Press play.

An unofficial, non-commercial fan app – free, no account, nothing to install.